VSE/CICSPerformance
Processor Relative Performance
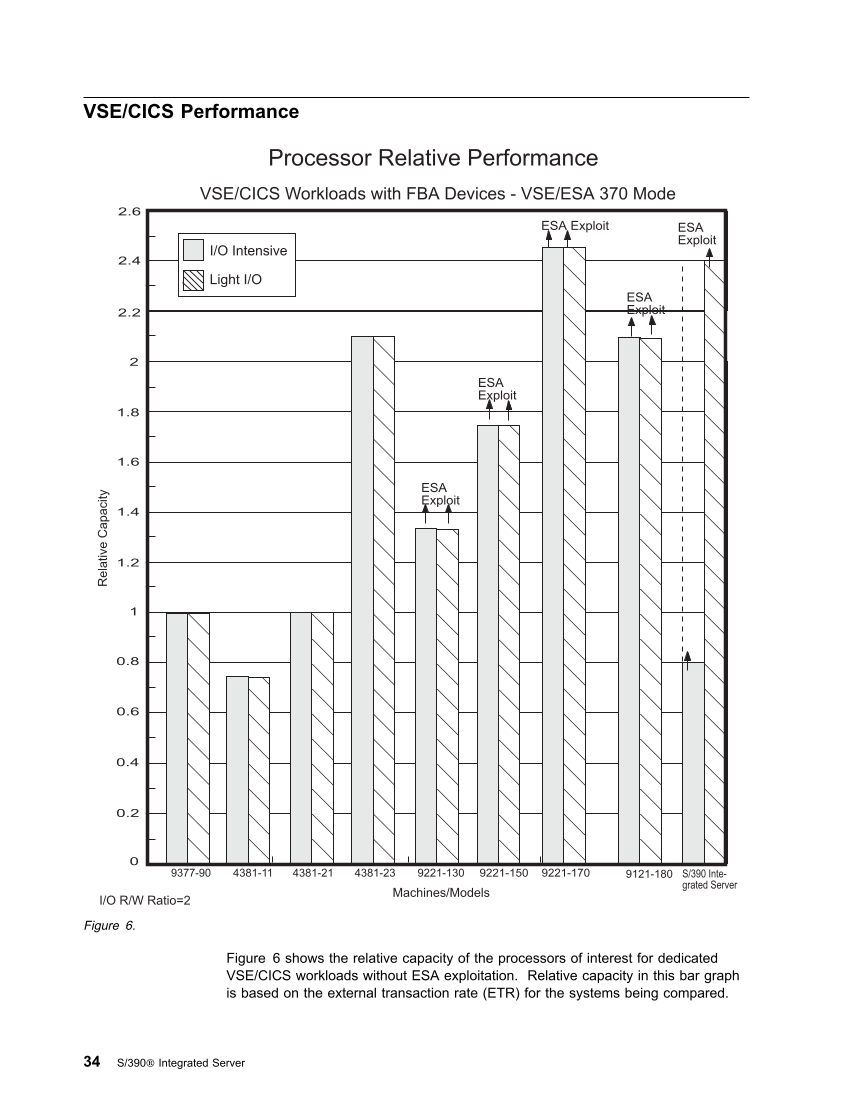
VSE/CICS Workloads with FBA Devices - VSE/ESA 370 Mode
Relative Capacity
Machines/Models
0
0.2
0.4
0.6
0.8
1.2
1.4
1.6
1.8
2
1
2.2
2.4
2.6
9377-90 4381-11 4381-21 9221-130 9221-150 4381-23 S/390 Inte-
grated Server
9221-170
ESA Exploit ESA
Exploit
ESA
Exploit
ESA
Exploit
ESA
Exploit
9121-180
I/O Intensive
Light I/O
I/O R/W Ratio=2
Figure 6.
Figure 6 shows the relative capacity of the processors of interest for dedicated
VSE/CICS workloads without ESA exploitation.Relative capacity in this bar graph
is based on the external transaction rate (ETR) for the systems being compared.
34 S/390 Integrated Server


