your source program, recompile it and attempt to execute it again.
your program,
access your program's storage areas and registers
immediately after receiving the abend
virtual machine in the debug environment.
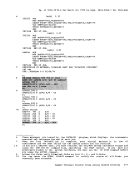
To check the contents of general registers
gpr
If you want to look at only one register, enter:
gpr 3
beginning at location
a different address on the LOAD or FETCH command. To identify the
virtual address of any instruction in a program,
and continue the execution of your program. There are
execution.
If, for example, the error occurred because
initialize a register to contain a zero,
execution with the
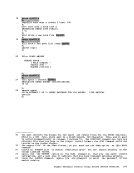
specify the instruction address at which you want execution to begin:
set gpr 11
is to resume is
the
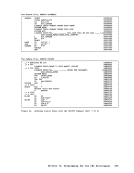
212