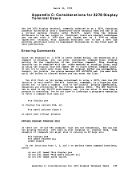
What To Do When Your Program Loops
If, when your program is executing, it seems to be in a loop, you should
first verify that it is looping, and then interrupt its execution and
either (1) halt it entirely and return to theCKS environment or (2)
resume its execution at an address outside of the loop.
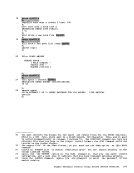
The first indication of a program loopmay be either what seems to be
an unreasonably long processing time, or, if you have a blip character
defined, an inordinately large number of blips.You can verify a loop by checking the PSi frequently. If the last
word repeatedly contains the same address, it is a fairly good
indication that your program is in a loop.You can check the PSi by
using the Attention key to enter the CP environment.You are notified
by the message:
CP
that your virtual machine is in the CP environment.You can then use
the CP commandDISPLAY to examine the PSi: cp display psw
and then enter the command BEGIN to resume program execution:
cp begin
If you are checking for a loop, you might enter both commands on the
sa.e line using the logical line end:
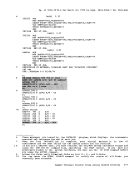
cp dplb When you have determined that your program is in a loop, you can halt
execution using theCMS Immediate command HX. To enter this command, you must press the Attention key once to interrupt program execution,
then enter:
hx
If you want your program to continue executing at an address past the
loop, you can use the CP command BEGIN to specify the address at which
you want to continue execution:
cp begin20cdO Or, you could use the CP command STORE to change the instruction address
in thePSi before entering the BEGIN command:
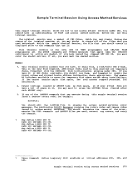
cp store psw0 20cdOIbegin Tracing Program Activity ihen your program is in a loop, or when you have a program that takes an
unexpected branch, you might need to trace the execution closely to
determine at what instruction the program goes astray. There are two
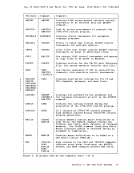
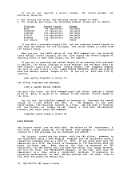
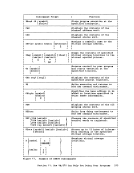
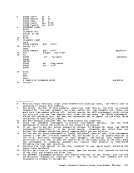
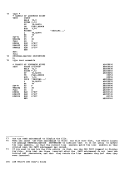
commands you can use to do this. TheSVCTRACE command is a CKS command
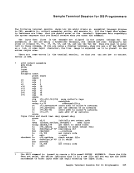
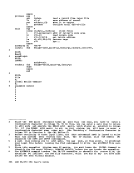
which traces allSVCs (supervisor calls) in your program. The TRACE
command is a CP command which allows you to trace different kinds of
information, including supervisor call instructions.
216IBM VM/370 eMS User's Guide
If, when your program is executing, it seems to be in a loop, you should
first verify that it is looping, and then interrupt its execution and
either (1) halt it entirely and return to the
resume its execution at an address outside of the loop.
The first indication of a program loop
an unreasonably long processing time, or, if you have a blip character
defined, an inordinately large number of blips.
word repeatedly contains the same address, it is a fairly good
indication that your program is in a loop.
using the Attention key to enter the CP environment.
by the message:
CP
that your virtual machine is in the CP environment.
the CP command
and then enter the command BEGIN to resume program execution:
cp begin
If you are checking for a loop, you might enter both commands on the
sa.e line using the logical line end:
cp d
execution using the
then enter:
hx
If you want your program to continue executing at an address past the
loop, you can use the CP command BEGIN to specify the address at which
you want to continue execution:
cp begin
in the
cp store psw
unexpected branch, you might need to trace the execution closely to
determine at what instruction the program goes astray. There are two
commands you can use to do this. The
which traces all
command is a CP command which allows you to trace different kinds of
information, including supervisor call instructions.
216