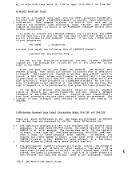
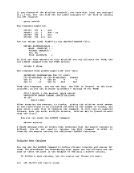
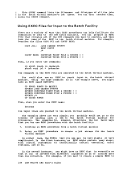
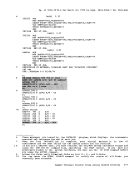
The DISPLAY command also displays the PSW, CAW, and CSi: cp display psw
cp display caw
cpdisplay csw iith the STORE command, you can change the contents of registers,
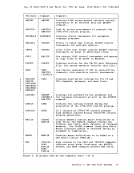
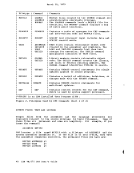
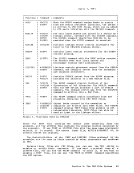
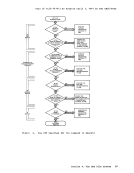
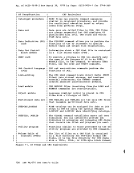
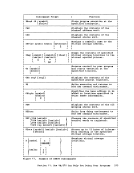
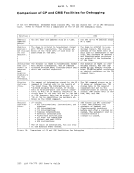
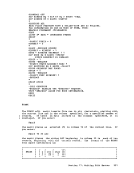
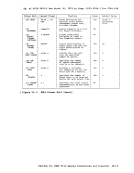
storage areas, or thePSi. As you can see, the CMS DEBUG subcommands and the CP commands ADSTOP, DISPLAY, and STORE, have many duplicate functions. The environment you
choose to work in,CP or debug, is a matter of personal preference. The
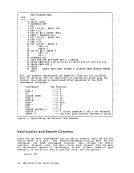
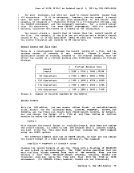
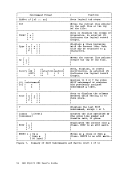
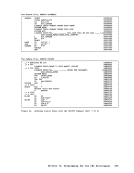
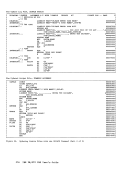
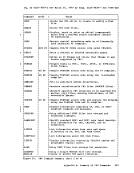
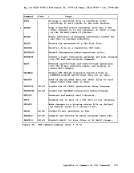
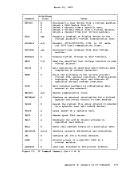
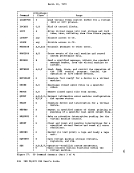
differences are summarized in Figure 18.What you should be aware of,
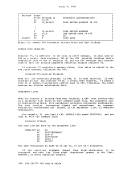
however, is that you should never attempt to use a combination ofCP commands and DEBUG subcommands when you are debugging a program. Since DEBUG itself is a program, when it is running (that is, when you are in
the debug environment), the registers thatCP recognizes as your virtual
machine's registers are actually the registers being used byDEBUG. DEBUG saves your program's registers and PSW and keeps them in a special
save area. Therefore, if you enter theDEBUG and CP commands to display
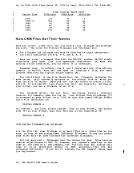
registers, you will see that the register contents are different:
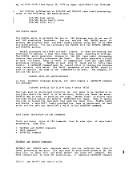
gpr0 15 tcp d g DEBUGGING WITH CP AFTER A PROGRAM CHECK When a program that is executing under CMS abends because of a program
check, theDEBUG routine is in control and saves your program's
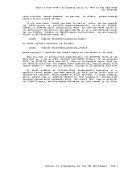
registers, so that if you want to begin debugging, youmust use the DEBUG command to enter the debug environment. You can prevent DEBUG from gaining
interruption occurs by turning on the wait
(locationX'68' in low storage):
cp store 6800020000 control when a
bit in theprogram program
newPSW You should do this before you begin executing your program. Then, if a
program check occurs during execution, whenCP tries to load the prograB new PSi, the wait bit forces CP into a disabled wait state and you
receive the message:DMKDSP450W CP ENTERED; DISABLED WAIT PSi All of your program's registers and storage areas remain exactly as they
were when program interruption occurred. ThePSi that was in effect
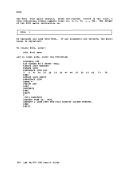
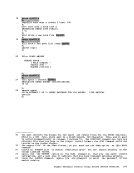
when your program was interrupted is in the program oldPSi, at location X'28'. Use the DISPLAY command to examine its contents:
cp display 28.8
The program newPSW, or the PSi you see if you enter the command DISPLAY PSW, contains the address of the DEBUG routine.
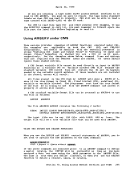
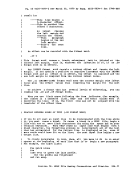
If, after usingCP to examine your registers and storage areas, you
can recover from the problem, you must use the STORE command to restore
thePSi, specifying the address of the instruction just before the one
indicated at locationX'28',. For example, if the instruction address in
your program isX'566' enter: 220 IBM VM/370 CMS User's Guide
cp display caw
cp
storage areas, or the
choose to work in,
differences are summarized in Figure 18.
however, is that you should never attempt to use a combination of
the debug environment), the registers that
machine's registers are actually the registers being used by
save area. Therefore, if you enter the
registers, you will see that the register contents are different:
gpr
check, the
registers, so that if you want to begin debugging, you
interruption occurs by turning on the wait
(location
cp store 68
bit in the
new
program check occurs during execution, when
receive the message:
were when program interruption occurred. The
when your program was interrupted is in the program old
cp display 28.8
The program new
If, after using
can recover from the problem, you must use the STORE command to restore
the
indicated at location
your program is