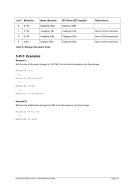
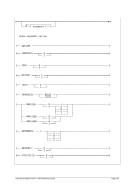
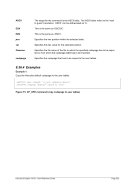
8.122.4 Examples
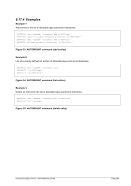
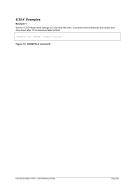
Example 1:
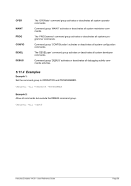
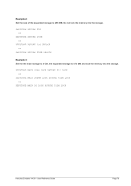
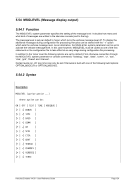
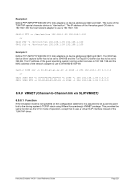
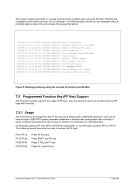
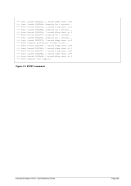
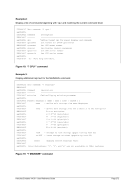
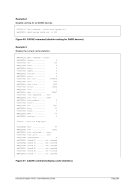
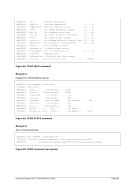
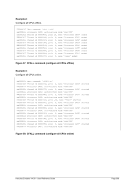
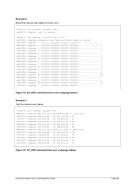
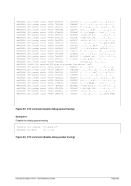
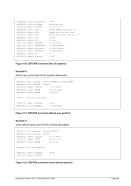
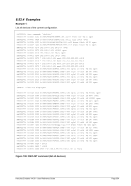
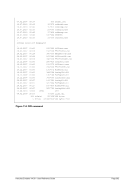
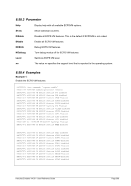
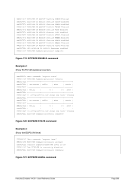
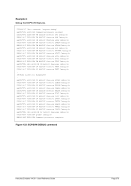
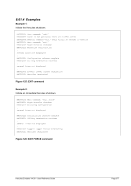
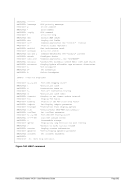
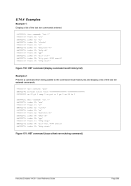
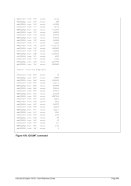
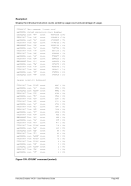
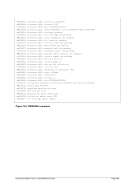
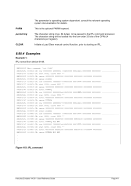
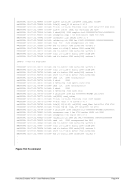
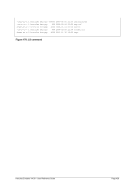
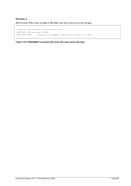
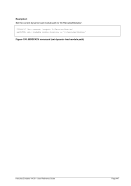
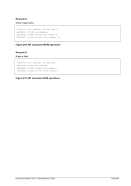
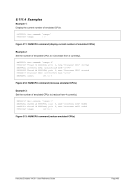
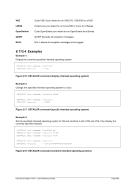
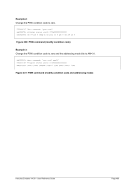
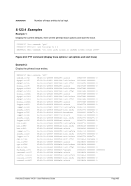
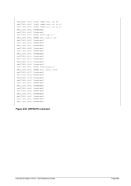
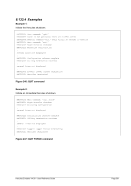
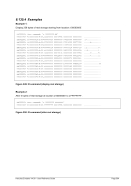
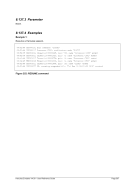
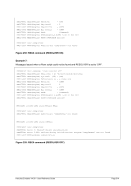
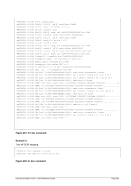
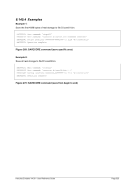
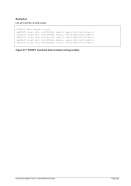
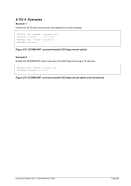
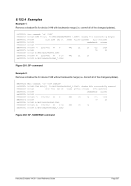
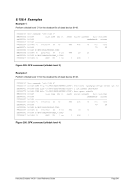
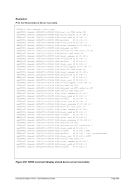
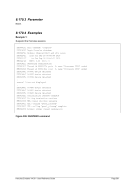
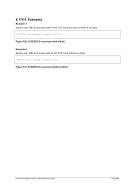
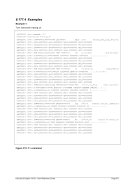
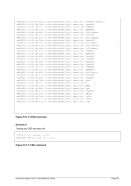
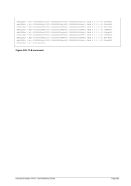
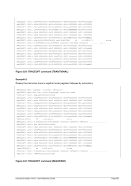
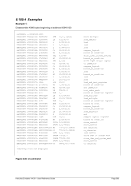
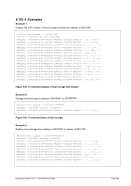
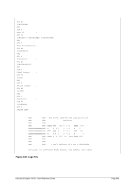
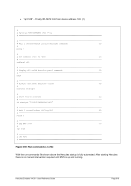
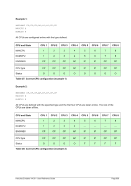
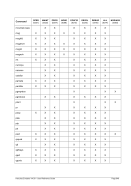
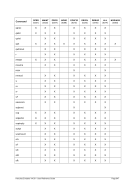
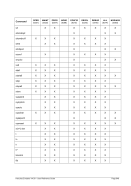
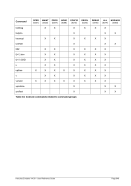
Enable the debug tracing for all PTP devices. Please note that not all hex columns can be displayed in
the figure below. Missing columns have been marked with “”.
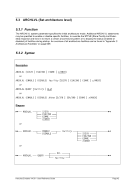
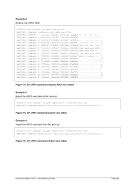
HHC00013I Herc command: 'ptp debug on all'
HHC02204I PTP debug set to on ALL
.
.
.
Figure 232: PTP command (enable debug tracing)
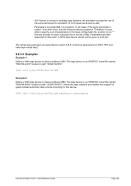
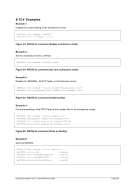
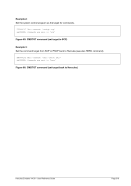
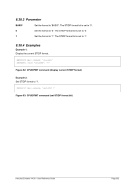
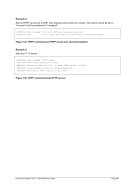
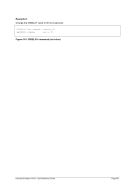
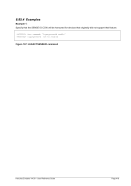
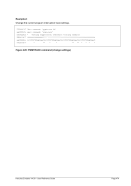
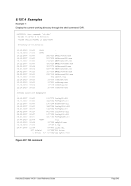
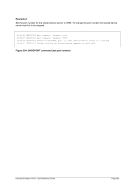
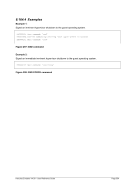
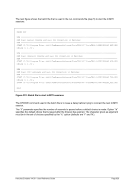
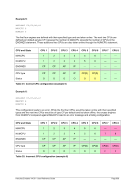
Example 2:
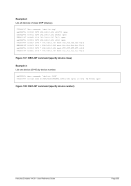
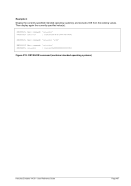
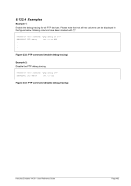
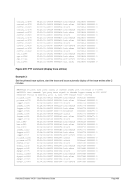
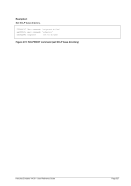
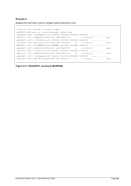
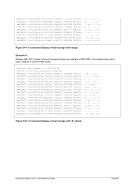
Disable the PTP debug tracing.
HHC00013I Herc command: 'ptp debug off'
HHC02204I PTP debug set to off
Figure 233: PTP command (disable debug tracing)