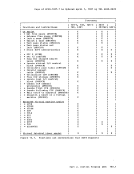
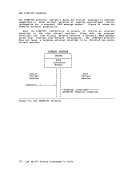
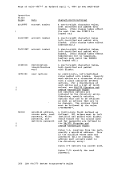
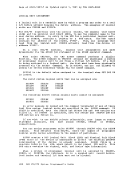
characteristics of that program in terms of resource usage.
spooling considerations, the INDICATE command may produce
results if entered while a program is issuingI/O requests.
Because of
unexpected
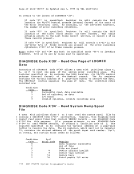
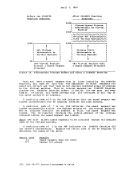
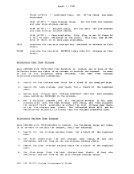
The system analyst can identify activeusers, the queues they are
using, theirI/O activity, their paging activity, and many other user
characteristics and usage data.
Thesystem analyst can use the data on system resource usage and contention to monitor the performance of his system. He can thus be
aware of heavy load conditions or low performance situations thatmay require the use of more sophisticated data collection, reduction, and
analysis techniques for resolution.
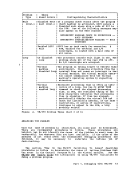
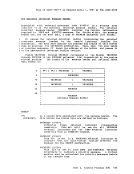
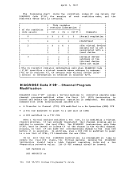
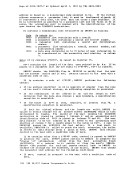
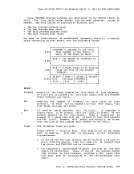
TheVM/370 scheduler maintains smoothed values of processor usage and main storage contention. Specifically, every 30 seconds, the scheduler
calculates the total wait time for the last interval and factors it into
a smoothed wait value in the following way:
(3X old smoothed wait
value + current interval wait)
New smoothed wait value = --------------------------------
4
Thus, only 1/4 of the most recent interval wait is factored into the new
smoothed wait which makes it predominantly the old smoothed wait value.
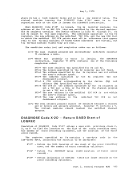
The remaining INDICATE components are sampled prior to a user being
dropped from a queue. Because of the frequency of this event, the
remaining components are subject to a heavier smoothing than the waittime. A general expression for the smoothing follows:
(15X old smoothed value + last
interval value)
New smoothed value = ---------------------------------
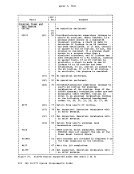
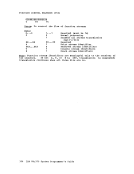
16Other operands of the command allow users to obtain other performance
information that enables them to understand the reasons for the observed
conditions.
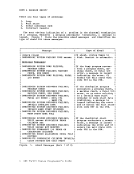
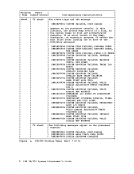
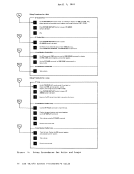
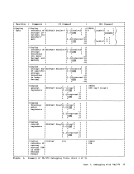
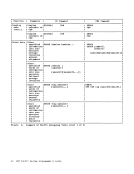
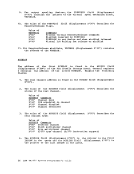
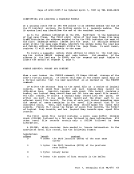
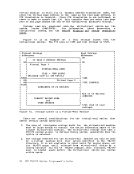
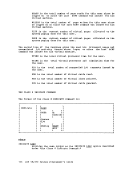
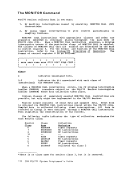
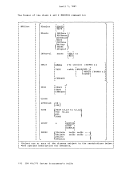
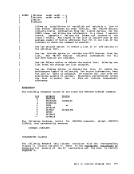
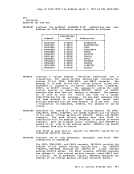
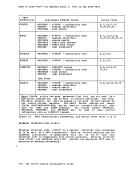
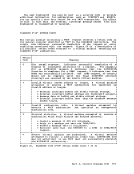
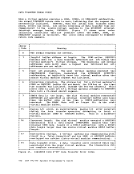
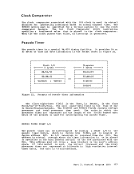
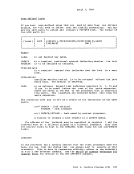
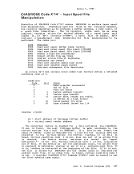
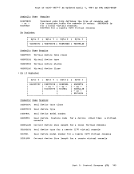
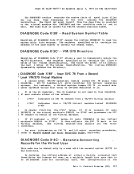
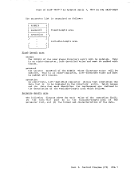
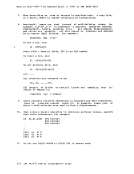
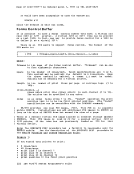
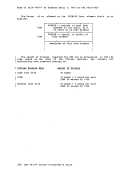
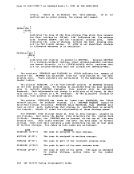
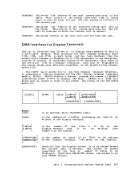
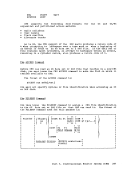
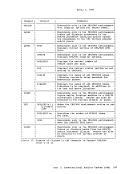
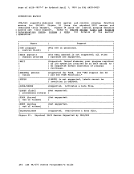
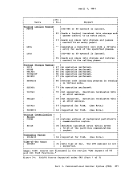
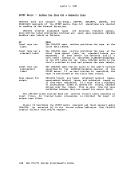
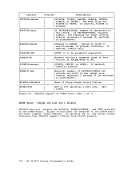
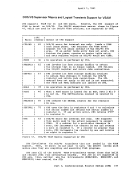
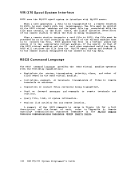
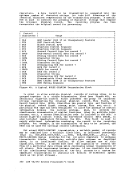
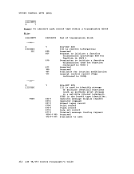
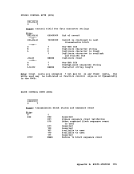
THE CLASS G INDICATECOMMAND The format of the class G INDICATE command is:
INDicate
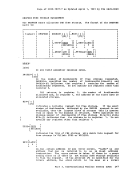
r ,ILOAQI IUSERI L J INDICATE LOAD -Produces the following response, where n is a decimal number: CPU-nnn% APU-nnn% Q1-nn Q2-nn STORAGE-nnn% RATIO-nnn The CPU figure indicates the percentage of time that the main processor is running and is derived from the smoothed wait
value maintained by the scheduler.
spooling considerations, the INDICATE command may produce
results if entered while a program is issuing
Because of
unexpected
The system analyst can identify active
using, their
characteristics and usage data.
The
aware of heavy load conditions or low performance situations that
analysis techniques for resolution.
The
calculates the total wait time for the last interval and factors it into
a smoothed wait value in the following way:
(3
value + current interval wait)
New smoothed wait value = --------------------------------
4
Thus, only 1/4 of the most recent interval wait is factored into the new
smoothed wait which makes it predominantly the old smoothed wait value.
The remaining INDICATE components are sampled prior to a user being
dropped from a queue. Because of the frequency of this event, the
remaining components are subject to a heavier smoothing than the wait
(15
interval value)
New smoothed value = ---------------------------------
16
information that enables them to understand the reasons for the observed
conditions.
THE CLASS G INDICATE
INDicate
r ,
value maintained by the scheduler.