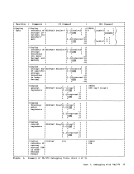
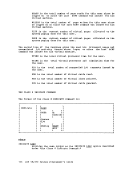
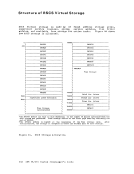
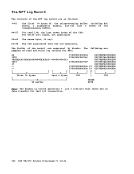
Fiqure
April 1, 1981
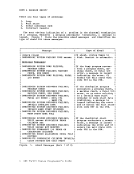
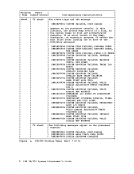
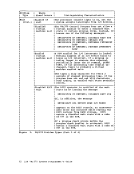
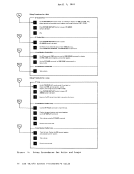
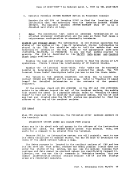
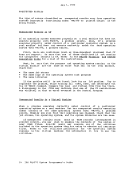
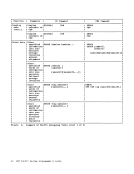
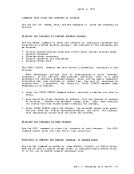
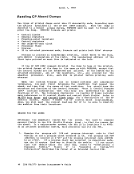
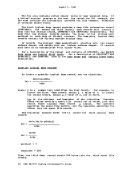
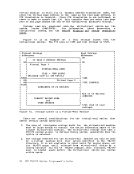
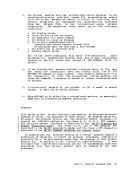
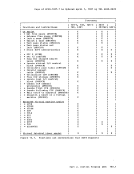
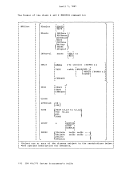
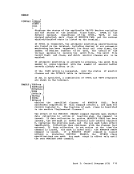
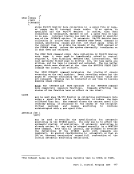
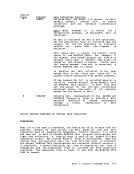
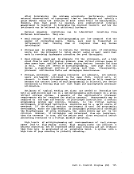
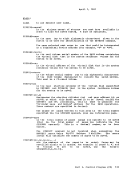
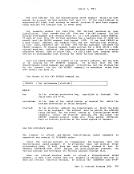
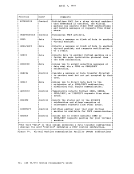
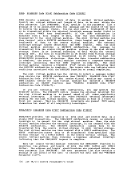
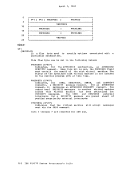
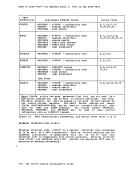
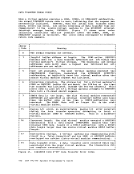
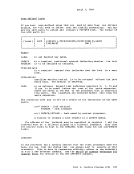
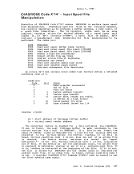
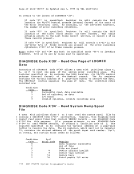
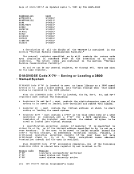
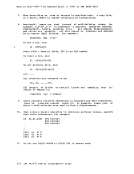
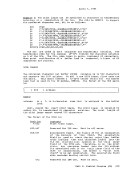
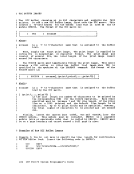
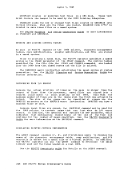
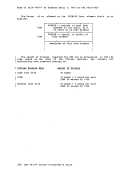
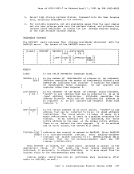
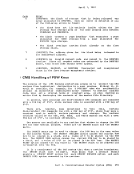
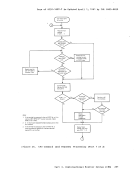
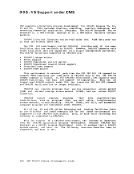
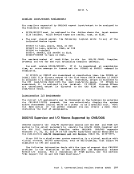
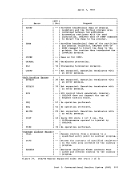
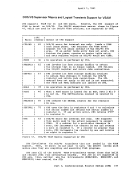
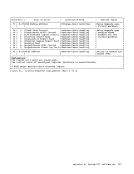
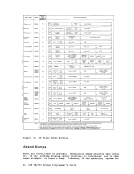
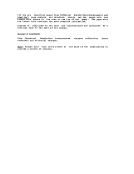
Debug Procedures for a Wait
4.
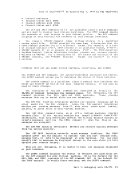
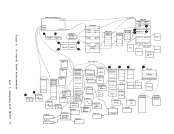
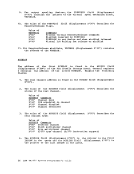
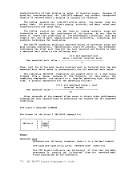
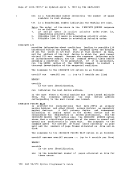
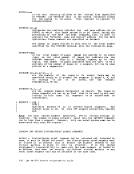
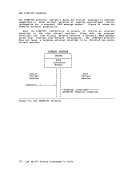
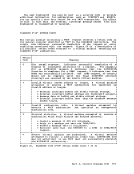
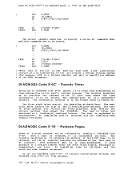
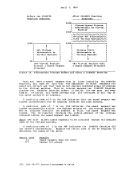
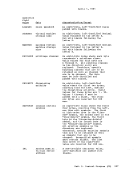
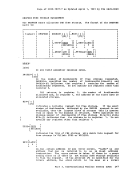
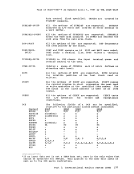
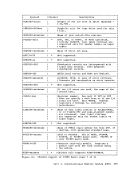
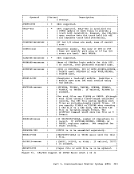
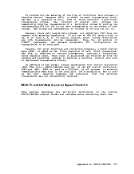
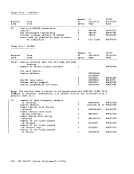
CPDisabled Wait • • Use AL TER/DISPLAY console mode (if available), to display real PSW and CSW. Also, display general and extended control registers and storage locations X·OO·-X·l00·. Press SYSTEM RESTART button to cause a CP ABEND
dump to be taken.IPL. CP Enabled Wait --------------------------------4 • Press SYSTEM RESTART button to cause a
CP ABEND dump to be taken.
Use the dump to check the status of eachVMBLOK. Also, check RCHBLOK. RCUBLOK. and RDEVBLOK for each device. Virtual Machine Disabled Wait --------------------------1 • Use CP commands (CMS users may use the CMS DEBUG command) to display
thePSW, CSW, general registers, and control registers.
Use the CP DUMP command (orCMS DUMP subcommand) to
take a dump.Virtual Machine Enabled Wait --------------------------/
Take adump.
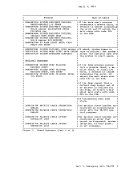
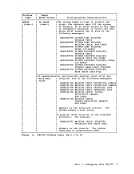
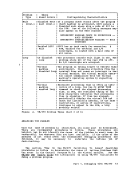
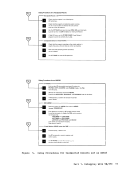
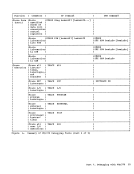
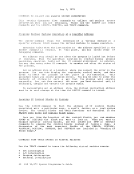
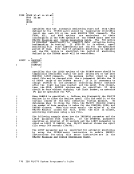
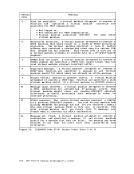
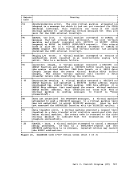
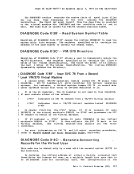
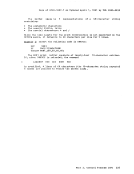
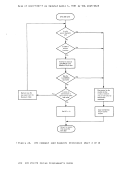
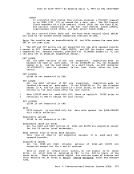
Debug Procedures for a Loop• • Use ALTER/DISPLAY console mode (if available) tei
displayreal PSW, general registers. control registers, and storage locations X·OO·-X·l00·. Press SYSTEM RESTART button to cause a CP
ABEND dump to be taken.
Examine the CP internal tracetable to see where the loop is. Virtual Machine Disabled Loop --------------------------1 • • • Use the CP TRACE command to trace the loop.
Display the general registers andcontrol llegisters via the CP DrSPLA Y command.
Take a dump using the CP DUMP command.
Examine the source code.Virtual Machine Enabled Loop --------------------------1
Trace theloop. Display the PSW, general registers,
and extended control registers.• Take a dump. • Examine source code.
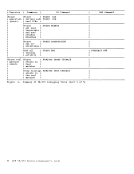
Debug Procedures forWaits and Loops
16IBM VM/J70 System programmer's Guide
April 1, 1981
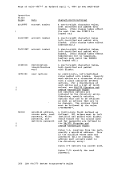
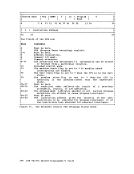
Debug Procedures for a Wait
4.
CP
dump to be taken.
CP ABEND dump to be taken.
Use the dump to check the status of each
the
Use the CP DUMP command (or
take a dump.
Take adump.
Debug Procedures for a Loop
display
ABEND dump to be taken.
Examine the CP internal trace
Display the general registers and
Take a dump using the CP DUMP command.
Examine the source code.
Trace the
and extended control registers.
Debug Procedures for
16