CMS users should use the DASD Dump Restore (DDR) service program to
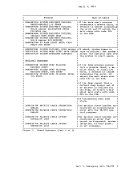
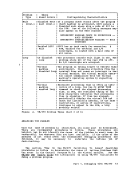
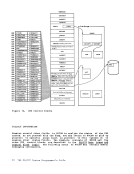
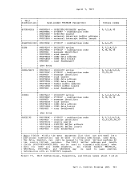
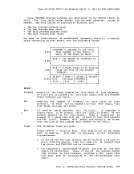
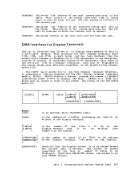
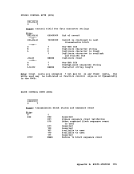
print or move the data stored on direct access devices. The VM/370 DASD Dump Restore (DDR) program can be invoked by the CMS DDR command in a
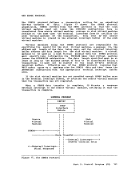
virtual machine controlled by The DDR program has the following
functions: -- dumps part, or all, of the data from a DASD device to
magnetic tape. -- transfers data from tapes created by DDR DUMP to a
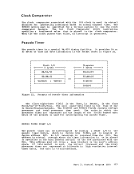
direct access device. The direct access device to which the data
is being restored must be the same type of device as the direct
access device originally containing that data. £QPY -- copies data from one device to another device of the same Data may be reordered, by cylinder, when copied from disk to In order to copy one tape to another, the original tape must
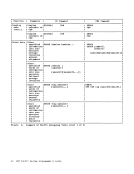
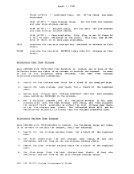
have been created by the DDR
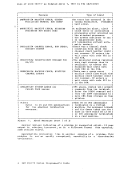
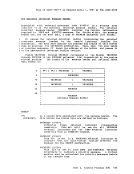
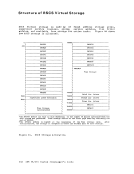
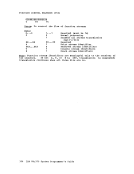
 DUMP function. l!INT selectively prints the hexadecimal and EBCDIC
representation of DASD and tape records on the virtual printer. !IPE selectively displays the hexadecimal and EBCDIC
representation of DASD and tape records on the terminal. CMS users should refer to the "Debugging with CMS" section fer
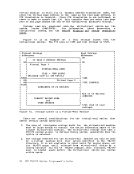
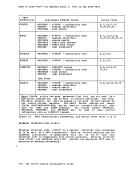
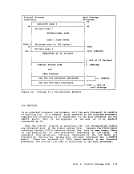
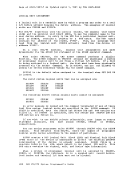
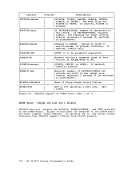
instructions on using the DDR command. The "Debugging with CP" section
contains information about executing the DDR program in a real or
virtual machine and a description of the DDR control statements. LOOP The real cause of a loop usually is an instruction that sets or branches
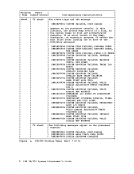
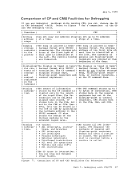
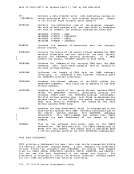
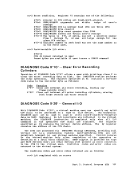
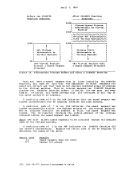
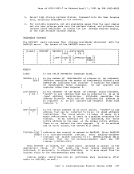
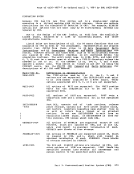
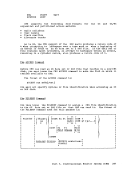
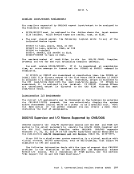
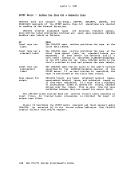
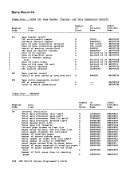
on the condition code incorrectly. The existence of a loop can usually
be recognized by the ceasing of productive processing and a continual
returning of the PSi instruction address to the same address. If I/O operations are involved, and the loop is a very large one, it may be
extremely difficult to define, and may even comprise nested loops.
Probably, the most difficult case of looping to determine is entry to
the loop from a wild branch. The problem in leop analysis is finding
either the instruction that should open the loop or the instruction that
passed control to the set of looping instructions.
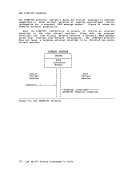
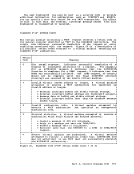
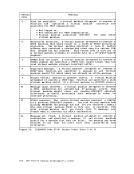
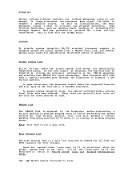
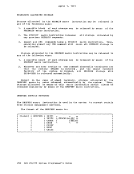
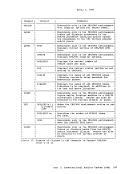
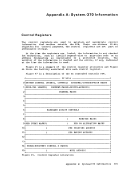
The processor o.perator should perform the following sequence when
gathering information to find the cause of a disabled loop. 1. Use the alter/display console mode to display the real PSi, general
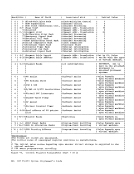
registers, control registers and storage locations X'OO' - X'100'. On an attached processor system, you must add the prefix value for
the PSA of each processor to display, dump, or alter low core
storage for each processor, or use the M or N operand prefixes
described under the DCP, DMCP, and STCP commands.
2. Press the SYSTEM RESTART button to caUse an Abend dump to be taken.
3. Save the information collected for the system programmer or system
support personnel. Part 1. Debugging with VM/370 25
After the processor operator has collected the information, the
system programmer or system support personnel examine it. If the cause
of the loop is not apparent,
1. Examine the CP internal trace table to determine the modules that
may be involved in the loop.
2. If the cause is not
caused the loop entry
branch,.
yet determined, assume that a wild branch
and search the source code for this wild When a disabled loop in a virtual machine exists, the virtual machine
operator cannot communicate with the virtual machine's operating system.
That means that signalling attention does not cause an interrupt.
Enter the CP console function mode.
1. Use the CP TRACE command to trace the entire loop. Display general
and extended control registers via the CP DISPLAY command.
2. Take a dump via the CP DUMP command.
3. Examine the source code. Use the information just gathered, along with listings, to try to
find the entry into the loop_ !Qte: You can IPL a standalone dump program such as the BPS Storage
Print to dump the storage of your virtual machine. If you choose to use
a standalone dump program, be sure to specify NOCLEAR on the IPL
command. Also, be aware that the CP IPL simulation destroys a page of
storage in your virtual machine and the standalone dump alters your
virtual storage while the CP DUMP command does net.
However, if the operating system in the virtual machine itself
manages virtual storage, it is usually better to use that operating
system's dump program. CP does not retrieve pages that exist only on
the virtual machine's paging device. The virtual machine operator should perform the following sequence when
attempting to find the cause of an enabled loop:
1. Use the CP TRACE command to trace the entire loop. Display the PSi and the general registers.
2. If your virtual machine has the Extended Control (EC) mode and the
EC option, also display the control registers.
3. Use the CP DUMP command to dump your virtual storage. CMS users
can use the debug DUMP subcommand. A standalone dump may be used.
but be aware that such a dump destroys the contents of some areas
of storage.
Previous Page Next Page