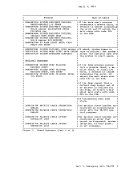
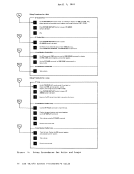
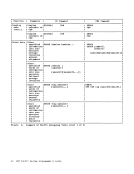
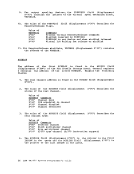
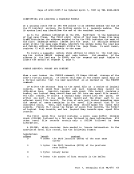
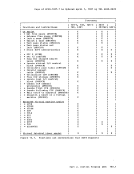
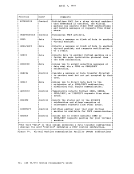
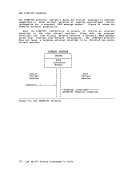
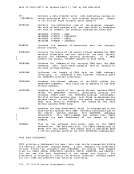
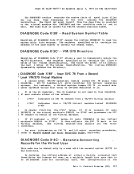
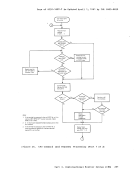
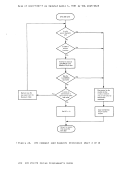
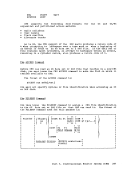
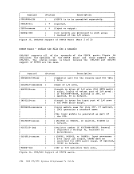
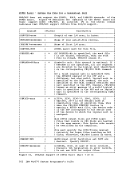
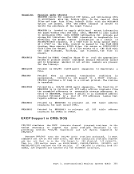
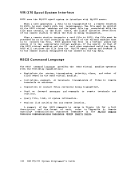
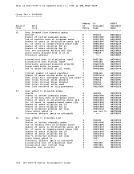
Performance Observation and Analysis Two commands, INDICATE and MONITOR, provide a way to dynamically measure
system performance.l!DICA!!: Provides the system analyst and general user with a method to
observe the load conditions on the system while it is running.
collection tool designed for sampling and recording a wide range of
data. The collection of data is divided into functional classes. The
different data collection functions can be performed separately or
concurrently. Keywords in theMONITOR command enable the collection of
data and identify the various data collection classes.Other keywords
control the recording of collected data on tape for later examination
and reduction.
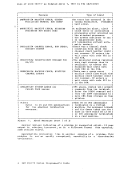
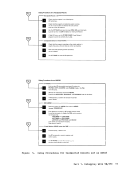
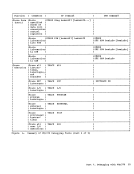
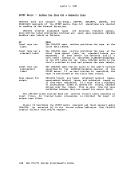
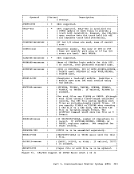
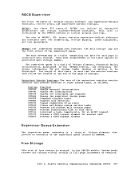
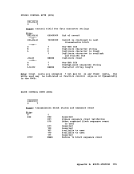
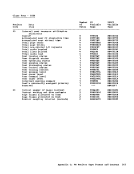
Load Indicators
The INDICATE com.and allows the system operator to check the system for
persistently heavy loads. He can, therefore, judge when it is best to
apply additional scheduling controls (if appropriate) or call a system
analyst to perform an analysis of the condition by using the INDICATE,
andMONITOR commands.
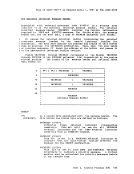
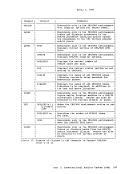
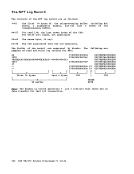
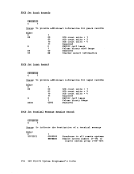
The system analyst has a set of operands in the INDICATE com.and that
enable him to understand the basic utilizations of and contentions for
major system resources (possible bottleneck conditions) and to identify
the userids and characteristics of the active users and the resources
that they use.Virtual machine users can use the INDICATE command to observe the
basic smoothed conditions of contention and utilization of the primary
resources of processor and storage. The INDICATE command allows them to
base their use of the system on an intelligent guess of what the service
is likely to be.Over a period of time, virtual machine users relate
certain conditions of service to certain utilization and contention
figures, and know what kind of responses to expect when they start their
terminal session.
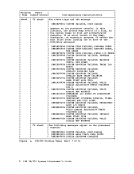
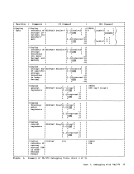
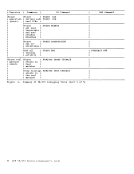
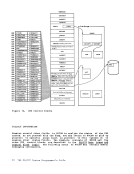
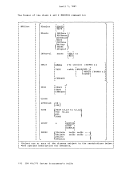
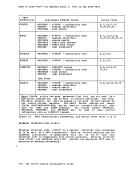
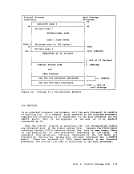
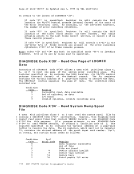
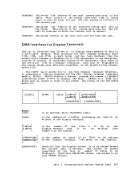
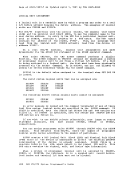
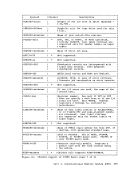
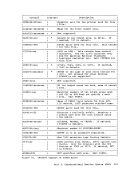
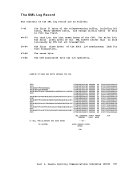
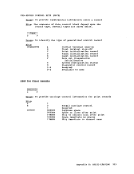
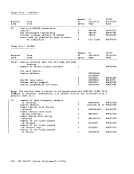
THE INDICATECOMMAND The INDICATE command allows the general user and the system analyst to
display at their consoles, the usage of and contention for majorsystem resources.
Theg.eneral __ usercan display usage _of and_contenti_on __ for _ the Jlajor system resources of processor and storage. He can also display the total amount of resources he has used during his terminal session and the
number ofI/O requests. If he uses the INDICATE command before and after
the execution of a program, he can determine the executionPart 2. Control Program (CP) 103
system performance.
observe the load conditions on the system while it is running.
collection tool designed for sampling and recording a wide range of
data. The collection of data is divided into functional classes. The
different data collection functions can be performed separately or
concurrently. Keywords in the
data and identify the various data collection classes.
control the recording of collected data on tape for later examination
and reduction.
Load Indicators
The INDICATE com.and allows the system operator to check the system for
persistently heavy loads. He can, therefore, judge when it is best to
apply additional scheduling controls (if appropriate) or call a system
analyst to perform an analysis of the condition by using the INDICATE,
and
The system analyst has a set of operands in the INDICATE com.and that
enable him to understand the basic utilizations of and contentions for
major system resources (possible bottleneck conditions) and to identify
the userids and characteristics of the active users and the resources
that they use.
basic smoothed conditions of contention and utilization of the primary
resources of processor and storage. The INDICATE command allows them to
base their use of the system on an intelligent guess of what the service
is likely to be.
certain conditions of service to certain utilization and contention
figures, and know what kind of responses to expect when they start their
terminal session.
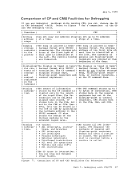
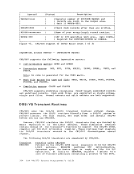
THE INDICATE
display at their consoles, the usage of and contention for major
The
number of
the execution of a program, he can determine the execution