How to Use VM/370 Facilities to Debug Once the problem and the area where it occurs are identified, you can
gather the information needed to determine the cause of the problem. The
type of information you want to look at varies with the type of problem.
The tools used to gather the information varydepending upon the area in
whichthe problem occurs. For example, if the problem is a loop
condition, you will want to examine thePSW. For a CP loop, you have to
use the operator's console to display thePSW, but for a virtual machine
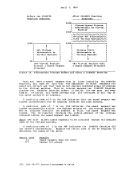
loop you can display thePSW via the CP DISPLAY command. The following sections describe specific debugging procedures for the
various error conditions. The procedures will tell you what to do and
what debug tool to use. For example, the proceduremay say dump storage
using theCP DUMP command. The procedure will not tell you how to use
the debug tool. Refer to the"CP Commands to Debug the Virtual Machine" and "CMS Debugging Commands" sections for a detailed description of each
debug tool, including how to invoke it.
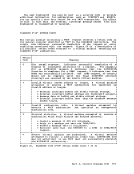
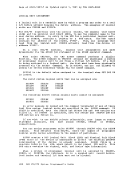
ABEND
Three types of abnormal terminations (ABEND) can occur onV8/370: CP abends, CMS abends, or virtual machine abends. The following
description provides guidelines for debugging each type of ABEND.When the 'M/370 Control Program abnormally terminates, a dump is taken.
This dump can be directed to tape or printer, cr dynamically allocated
to a direct access storage device. The outputdevice for a CP abend dump is specified by the CP SET command. See the "Abend Dumps" section for a
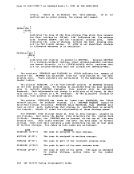
description of theSET and VMFDUMP commands. Use the dump to determine why the control program terminated and then
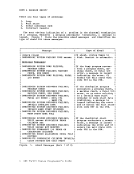
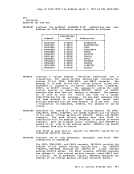
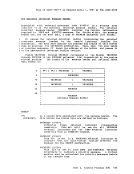
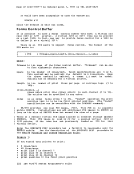
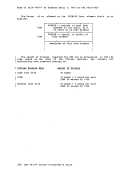
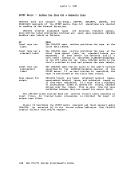
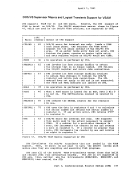
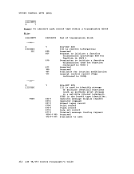
determine how to correct the condition.See the "Reading CP Abend Dumps" discussion for detailed information on reading a CP abend dump. REASON FOR THE ABEND: CP will terminate and take an abnormal termIriation dump under-three conditions: 1. Program Check in CP Examine the PROPSi and INTPR fields in the prefix storage area (PSA) to determine the failing module.
2.Module Issuing an SVC 0 Examine the SVC old PSW (SVCOPSW) and abend code (CPABEND) fields
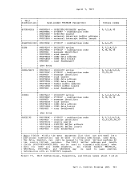
in thePrefix Storage Area to determine the module that issued the SVC 0 and the reason it was issued. CPABEND contains an abnormal termination code. The first three
characters identify the failing module (fer example, abend codeTRCOOl indicates DMKTRC is the failing module).
18IEH iM/37C System Plugrammer=s Guide
gather the information needed to determine the cause of the problem. The
type of information you want to look at varies with the type of problem.
The tools used to gather the information vary
which
condition, you will want to examine the
use the operator's console to display the
loop you can display the
various error conditions. The procedures will tell you what to do and
what debug tool to use. For example, the procedure
using the
the debug tool. Refer to the
debug tool, including how to invoke it.
ABEND
Three types of abnormal terminations (ABEND) can occur on
description provides guidelines for debugging each type of ABEND.
This dump can be directed to tape or printer, cr dynamically allocated
to a direct access storage device. The output
description of the
determine how to correct the condition.
2.
in the
characters identify the failing module (fer example, abend code
18