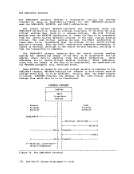
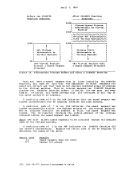
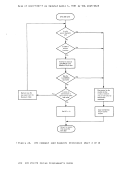
After the processor operator has collected the information, the
system programmer or system support personnel examineit. If the cause
of the loop is not apparent,
1. Examine the CP internal trace table to determine the modules that
may be involved in the loop.
2. If the cause is not
caused the loop entry
branch,.
yet determined, assume that a wild branch
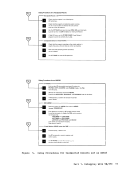
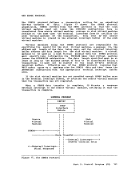
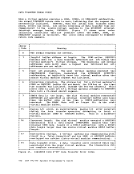
and search the source code for this wildWhen a disabled loop in a virtual machine exists, the virtual machine
operator cannot communicate with the virtual machine's operating system.
That means that signalling attention does not cause an interrupt.
Enter the CP console function mode.
1.Use the CP TRACE command to trace the entire loop. Display general
and extended control registers via the CPDISPLAY command.
2. Take a dump via the CPDUMP command.
3. Examine the source code.Use the information just gathered, along with listings, to try to
find the entry into theloop_ !Qte: You can IPL a standalone dump program such as the BPS Storage
Print to dump the storage of your virtual machine. If you choose to use
a standalone dump program, be sure to specifyNOCLEAR on the IPL
command. Also, be aware that the CP IPL simulation destroys a page of
storage in your virtual machine and the standalone dump alters your
virtual storage while the CPDUMP command does net.
However, if the operating system in the virtual machine itself
manages virtual storage, it is usually better to use that operating
system's dump program. CP does not retrievepages that exist only on
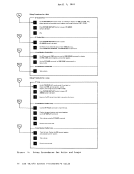
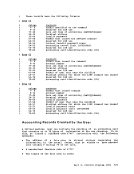
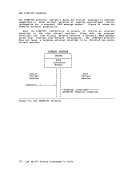
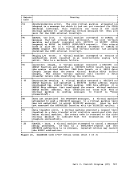
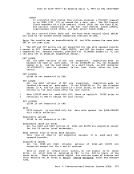
the virtual machine's pagingdevice. The virtual machine operator should perform the following sequence when
attempting to find the cause of an enabled loop:
1.Use the CP TRACE command to trace the entire loop. Display the PSi and the general registers.
2. If your virtual machine has the Extended Control (EC) mode and the
EC option, also display the control registers.
3.Use the CP DUMP command to dump your virtual storage. CMS users
can use the debugDUMP subcommand. A standalone dump may be used.
but be aware that such a dump destroys the contents of some areas
of storage.
system programmer or system support personnel examine
of the loop is not apparent,
1. Examine the CP internal trace table to determine the modules that
may be involved in the loop.
2. If the cause is not
caused the loop entry
branch,.
yet determined, assume that a wild branch
and search the source code for this wild
operator cannot communicate with the virtual machine's operating system.
That means that signalling attention does not cause an interrupt.
Enter the CP console function mode.
1.
and extended control registers via the CP
2. Take a dump via the CP
3. Examine the source code.
find the entry into the
Print to dump the storage of your virtual machine. If you choose to use
a standalone dump program, be sure to specify
command. Also, be aware that the CP IPL simulation destroys a page of
storage in your virtual machine and the standalone dump alters your
virtual storage while the CP
However, if the operating system in the virtual machine itself
manages virtual storage, it is usually better to use that operating
system's dump program. CP does not retrieve
the virtual machine's paging
attempting to find the cause of an enabled loop:
1.
2. If your virtual machine has the Extended Control (EC) mode and the
EC option, also display the control registers.
3.
can use the debug
but be aware that such a dump destroys the contents of some areas
of storage.