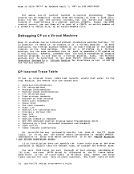
can be used to help you debug
useful in debugging is also included. The following topics are
discussed in this section:
The debug environment is
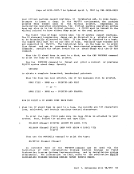
However, while in the debug environment,
command can be used to:
in the debug environment.
subcommands of the
specific locations.
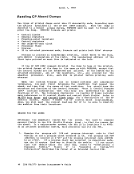
status word), old
the terminal.
terminal.
directory.